
To interpret Skew-T Log-P charts for soaring, focus on the wind profile at various pressure levels to spot shear and veering winds that can indicate turbulence or lift zones. Check the temperature and dew point lines to identify temperature gradients and moisture, signaling thermals and cloud development. Pay attention to stability indices like CAPE for thermal strength. Understanding these factors helps you assess conditions and plan your flight better—keep exploring to gain deeper insights into these atmospheric clues.
Key Takeaways
- Analyze wind barbs at various pressure levels to identify shear, veering winds, and turbulence potential affecting soaring conditions.
- Examine temperature and dew point lines to assess thermal activity, stability, and the likelihood of strong thermals.
- Identify steep temperature gradients indicating unstable atmospheres conducive to lift development.
- Use stability indices like CAPE to evaluate energy available for thermal formation and overall soaring prospects.
- Integrate wind profiles, temperature gradients, and humidity data for a comprehensive understanding of atmospheric conditions.

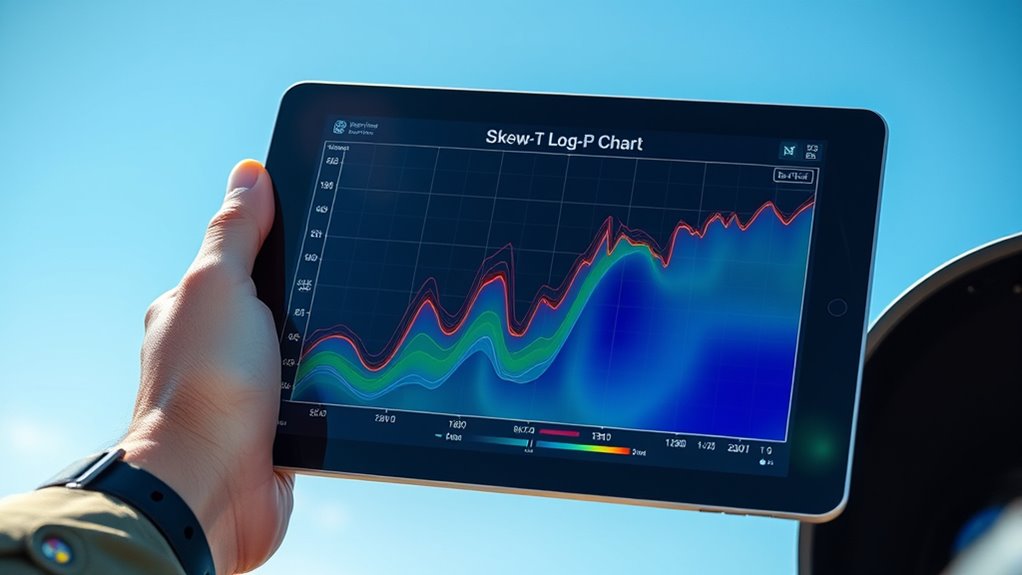
A Skew-T Log-P chart is an indispensable tool for meteorologists and weather enthusiasts to analyze atmospheric stability and forecast weather conditions. When you’re interpreting these charts for soaring, understanding wind profiles and temperature gradients becomes essential. Wind profiles, shown through wind barbs plotted at various pressure levels, reveal how wind speed and direction change with altitude. Sharp shifts or veering winds often indicate turbulence or the potential for lift, both critical for soaring activities. By studying these profiles, you can identify areas where wind shear might help or hinder your flight.
Temperature gradients, represented by the temperature curve on the chart, show how temperature varies with altitude. Steeper gradients suggest a more unstable atmosphere, which is preferable for soaring because it promotes thermal development. Conversely, a more gradual temperature change indicates stability, where thermals are weaker or absent. Recognizing these temperature gradients helps you determine the likelihood of strong thermals forming, guiding your decision to launch or seek lift.
Steeper temperature gradients indicate unstable air, fostering stronger thermals ideal for soaring.
As you examine the chart, focus on the relationship between temperature and dew point lines. When these lines are close together at certain levels, it indicates high humidity and potential cloud formation or thermals. These moist layers often coincide with active thermals, so identifying these zones allows you to target areas with the best lift prospects. Additionally, analyzing the wind profile in conjunction with the temperature gradient provides a holistic picture of atmospheric conditions. For instance, a strong wind shear coupled with an unstable temperature gradient can create turbulent conditions, but also enhance thermal development.
Interpreting the chart’s stability indices, like CAPE (Convective Available Potential Energy), can further inform your soaring strategy. Higher CAPE values mean more energy for thermals, often linked to steep temperature gradients and favorable wind profiles. By integrating all these factors—wind profiles, temperature gradients, humidity, and stability indices—you develop a nuanced understanding of the atmosphere’s behavior.
Ultimately, mastering how to read and interpret a Skew-T Log-P chart empowers you to make informed decisions during your flights. Recognize patterns indicating strong thermals, turbulence, or stable conditions, and adjust your tactics accordingly. Whether you’re planning a cross-country glide or simply seeking the best lift, understanding these key elements ensures safer, more successful soaring adventures.
As an affiliate, we earn on qualifying purchases.
Frequently Asked Questions
How Can I Determine Cloud Base From a Skew-T Chart?
To estimate cloud base from a skew-T chart, look for the temperature and dew point lines. The cloud base forms where the dew point temperature intersects the temperature lapse rate. As the dew point rises toward the temperature, it indicates condensation. You can then read this height off the chart’s pressure scale, giving you a clear cloud base estimate, which helps assess soaring conditions and thermal activity.
What Indicates Potential for Mountain Wave Activity?
You might think mountain wave activity is unpredictable, but certain mountain wave indicators in skew‑T charts can boost your forecast accuracy. Look for strong winds aloft, especially wind speed increases with height, and a stable layer with a temperature inversion above rugged terrain. These signs suggest potential for mountain wave formation, helping you anticipate lift and turbulence. Recognizing these indicators enhances your soaring plans and safety.
How Do I Assess Turbulence Risk From the Chart?
To evaluate turbulence risk from the chart, look for turbulence indicators such as rapid temperature changes, wind shear, and instability layers. Pay attention to regions with steep lapse rates and strong wind gradients, especially near jet streams. Consider forecast confidence; if the data shows high uncertainty, turbulence predictions are less reliable. Combining these indicators helps you gauge potential turbulence and plan your flight to ensure safety.
What Parameters Best Predict Thermals for Soaring?
Think of the sky as a treasure chest; the key to finding thermals lies in the parameters you observe. Look for signs like rising thermal strength indicated by steep lapse rates and the presence of cumulus clouds, which form where warm air rises and cools. These clues help you pinpoint where thermals will be strongest, guiding your soaring adventures with confidence.
How Reliable Are Skew-T Forecasts for Real-Time Soaring Decisions?
Skew-T forecasts are fairly reliable for real-time soaring decisions, but weather variability can affect their accuracy. You should use them as a helpful guide rather than a guarantee, always considering recent observations and local conditions. Keep in mind that forecast accuracy decreases with time, so the closer your decision point, the more dependable the data. Combine skew-T insights with on-the-ground cues for the best results.
Conclusion
By mastering Skew-T Log-P charts, you open the door to clearer skies and more confident soaring. While the clouds may sometimes whisper uncertainties, your understanding guides you safely through. Embrace each forecast as a gentle nudge toward better decisions, trusting your skills to navigate the unseen. With patience and practice, you’ll find the horizon gentler and the journey more inspiring, turning potential doubts into the quiet confidence that lifts you higher.